Algorithm Overview
The Loop Algorithm
The Loop algorithm for adjusting insulin delivery is oriented around making a glucose prediction and modifying delivery to bring that prediction within target range without going below the Glucose Safety Limit. Every five minutes, triggered by new glucose data, it generates a new prediction. Both bolus recommendations and temporary basal rate adjustments are set based on this prediction.
Glucose Prediction
The prediction is a calculation based on the known parameters of current and historical glucose values, current and historical insulin delivery using any entered carbs. Loop's model predictive control (MPC) calculation includes the user's therapy settings modified by active overrides. This calculation is updated at the next glucose reading and the recommended insulin delivery may be updated.
The predicted glucose shown assumes no changes to future insulin delivery, when in fact, the insulin delivery is likely to be modified based on actual glucose. In that sense, the glucose prediction shown in various charts in the Loop app are meant to communicate the reason for the current dosing from Loop. Especially in the case of very low or very high predictions, be assured that Loop will attempt to change dosing to prevent that future glucose from happening, while keeping the user above the Glucose Safety Limit.
Algorithm Terminology
This graph and legend illustrates terms commonly used in discussing Loop's algorithm, and shows them in the context of historical and predicted glucose in style similar to the status screen of Loop.
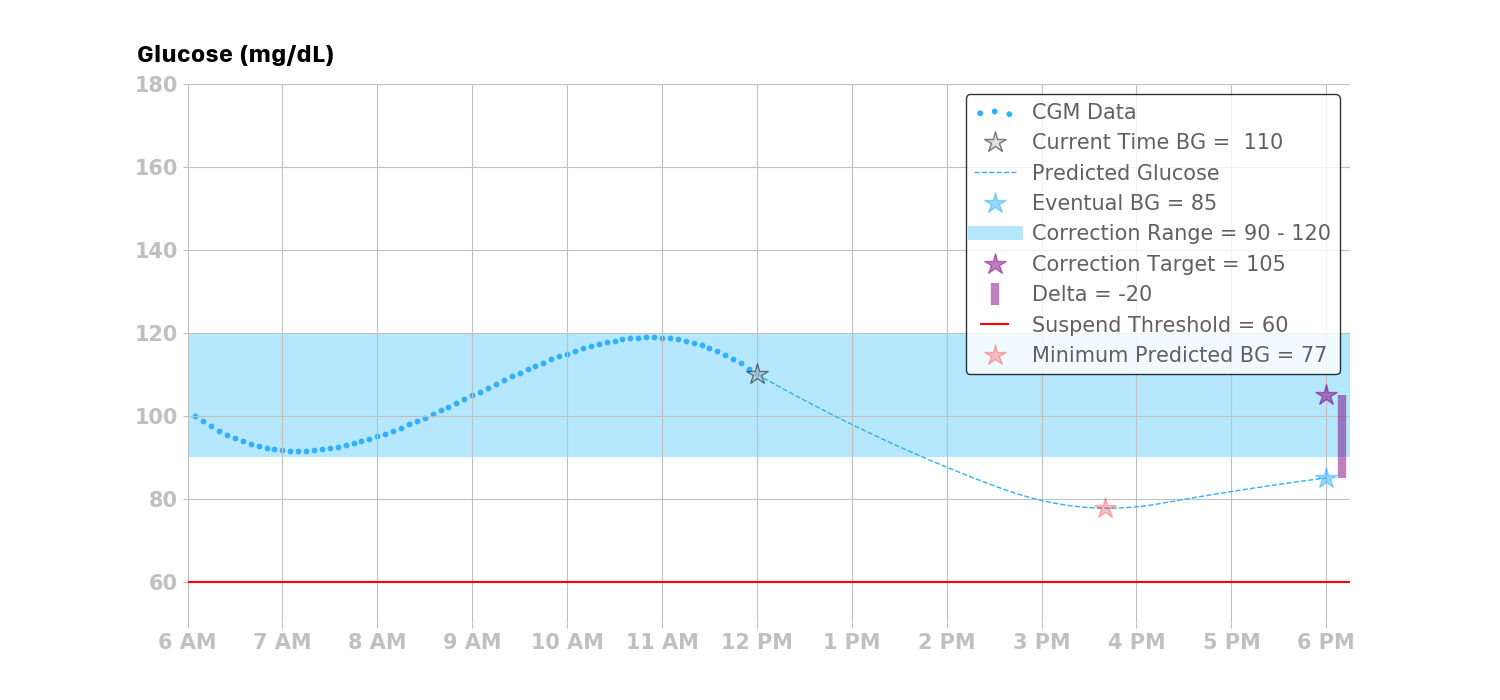
| Insulin activity duration | The insulin activity duration is the duration of the insulin activity curve, and describes the point at which the delivered insulin dose no longer affects glucose. The insulin activity duration is 6 hours for Loop's rapid-acting and ultra-rapid insulin models. |
| Correction range | The correction range is the glucose range Loop uses to determine corrective actions (e.g., between 90 and 120 mg/dL in the figure). NOTE: Loop’s correction range is a user setting and should not be confused with the target range, typically 70-180 mg/dL, used for the purpose of calculating the percent time in range. |
| Correction minimum | The lower or minimum value of the user’s correction range, which is 90 mg/dL in the figure. |
| Correction maximum | The upper or maximum value of the user’s correction range, which is 120 mg/dL in the figure. |
| Correction target | The correction target is the average value of the correction range. In the overview figure, this is 105 mg/dL given that the correction minimum is 90 mg/dL and the correction maximum is 120 mg/dL. |
| Predicted glucose | Loop makes a prediction of glucose values out for a length of time equal to your insulin action duration. The predicted glucose is the basis for how Loop makes its insulin delivery recommendations and actions. |
| Eventual glucose | The last value of the predicted glucose curve, in other words the very last glucose predicted at the end of your insulin action duration. In the figure above, this is 85 mg/dL. |
| Minimum predicted glucose | The lowest glucose value at any point in time within the prediction. In the figure above, this is 77 mg/dL. |
| Delta | The delta is the difference between the eventual glucose and the correction target. In the overview figure, the eventual glucose is 85 mg/dL and the correction target is 105 mg/dL, which means that the delta is -20 mg/dL. |
| Suspend Threshold (Glucose Safety Limit) | The glucose safety limit (called suspend threshold when this figure was generated) is a safety feature of the Loop algorithm. If any predicted glucose is below this value, the Loop algorithm will issue a temporary basal rate of 0 |
| CGM data | Glucose readings made by a continuous glucose monitor. |
| Insulin sensitivity factor | A configuration value that provides an estimate of how much glucose will drop given a unit of insulin. |
| Active insulin | Active insulin, often referred to as Insulin-on-Board (IOB), is the remaining amount of insulin activity from boluses and temporary basal rates relative to a user’s scheduled basal rates. More specifically, it is the total amount of insulin activity due to all bolus and basal insulin delivered within the last N hours, where N is determined by the insulin activity duration. The amount of “active” insulin depends upon the insulin activity curve, and also accounts for the insulin withheld via basal suspensions. As such, it is possible that the active insulin can be negative. Negative active insulin will result in an increase in predicted glucose. The active insulin displayed in Loop's main display does not reflect the currently enacted temporary basal rate, as that basal rate may be canceled or modified before completion over the next 30 minutes. In others words, Loop doesn't count chickens before the eggs hatch...insulin delivery must be confirmed before being added to the active insulin reporting. |